Annual report and accounts 2022/23
Downloads
Our financial resources
Our funding structure
Our funding structure consists of 5 core aspects:
- Fee income – we are mainly funded through annual fees charged to registered providers.
- Revenue grant-in-aid (GIA) – an allocation provided by the Department of Health and Social Care (DHSC) for costs that, under HM Treasury rules, are not chargeable through our fee structure.
- Capital grant-in-aid (GIA) – provided by DHSC to fund our capital expenditure activity as this is not chargeable through fees.
- Non-cash allocation – provided by DHSC to fund depreciation for non-chargeable activity.
- Contract and other income – we have a small level of contract income for reimbursement for services and other income.
HM Treasury has clear rules for recovering the full cost of relevant chargeable regulatory activity through our fees, as outlined in Managing Public Money. Our current fees scheme became effective on 1 April 2019 and is set at a level to cover the cost of our chargeable regulatory activities. To provide stability and help providers in their financial planning, our fee scheme again remained unchanged for 2023/24, the fourth consecutive year.
We will be reviewing our fee scheme and aim to transition to a new simpler fees scheme at a future point. This is to ensure that our fee scheme remains relevant to the changing health and social care landscape, our new regulatory accountabilities and approach, and to provide greater certainty to CQC-registered providers,
We continue to work with the Department of Health and Social Care to keep under review the regulatory activities that are chargeable through fees. This is because we aim to reduce our reliance on GIA to save the public purse and to be as efficient and economic as possible, with the aim to absorb additional costs rather increasing fees to our providers.
Our total financial resource
In 2022/23, the total financial resource available to us for revenue and capital activities amounted £263.8m, which we used and managed effectively, spending £263m (figures 1 and 2).
Figure 1: CQC total financial resource, revenue operating resource and capital resource for 2022/23
CQC total financial resource for 2022/23: £263.8M

CQC revenue operating resource 2022/23: £242.8M

CQC Capital Resource Resource 2022/23: £15.6M

Figure 2: Utilisation of our financial resources

Fee income
Fee income from registered providers is the main source of our revenue funding accounting for 88.9% of our annual revenue operating budget (£220.8m), and 83.7% of our total funding.
Figure 3 illustrates the provider sectors from which fee income was generated in 2022/23, with 50.7% from private sector organisations and 49.3% from public sector organisations such as NHS trusts, NHS GP practices, local authorities and NHS Blood and Transplant (figure 4).
Figure 3: Private vs public sector split of fee income 2022/23

Figure 4: CQC fee income by sector 2022/23

Department of Health and Social Care Grant in Aid (GIA) funding allocations
In 2022/23, CQC was allocated a total of £40.2m from DHSC (Figure 1). This funding source forms 9.5% of our annual operating revenue budget (£23.5m) and 100% of our annual capital budget (£15.6m) and non-cash allocation for non-chargeable depreciation (£1.1m).
Our revenue GIA allocation funds our recurrent non-chargeable statutory activities such as enforcement, Mental Health Act activities, Healthwatch England, Market Oversight, IR(ME)R, Health and Justice inspections, Childrens Services inspections and the National Guardian’s Freedom to Speak Up Office. In 2022/23, we also received a non-recurrent revenue GIA allocation to scope out additional work and duties in relation to local authority assurance, integrated care systems, and Mental Health Act reform (Figure 5).
Figure 5: 2022/23 CQC revenue grant in aid allocation from DHSC (£23.5M)

In 2022/23, we continued to deliver within our allocations and continue to provide savings against our baseline allocation in line with DHSC targets. During the year, we saw a 13.7% or £3.2m reduction to our recurrent revenue GIA allocation provided by DHSC compared with that in 2021/22, despite inflationary pressures, continuing our trend of saving the public purse since 2018/19 as (Figure 6).
Figure 6: Our recurring Revenue GIA allocation since 2018/19

Contract and other income
A small proportion (1.1% or £2.8m) of our funding is driven by contract income and reimbursement for services from other external sources, in which we recover what we spend from the associated organisations we contract with. We do not charge a profit. Figure 7 highlights our contracted income funding for 2022/23.
Figure 7: 2022/23 contract and other income (£2.8M)

How we used our financial resource
During 2022/23, we used £263m of the total financial resource available to us (both revenue and capital). Figure 8 shows that was used against 3 main areas of our operation: delivering our regulatory responsibilities, supporting the delivery of our purpose, and developing our regulation and accelerating improvement. A small amount was used for depreciation and amortisation of our assets.
Figure 8: We utilised £263.0M of the financial resource available to us in 2022/23
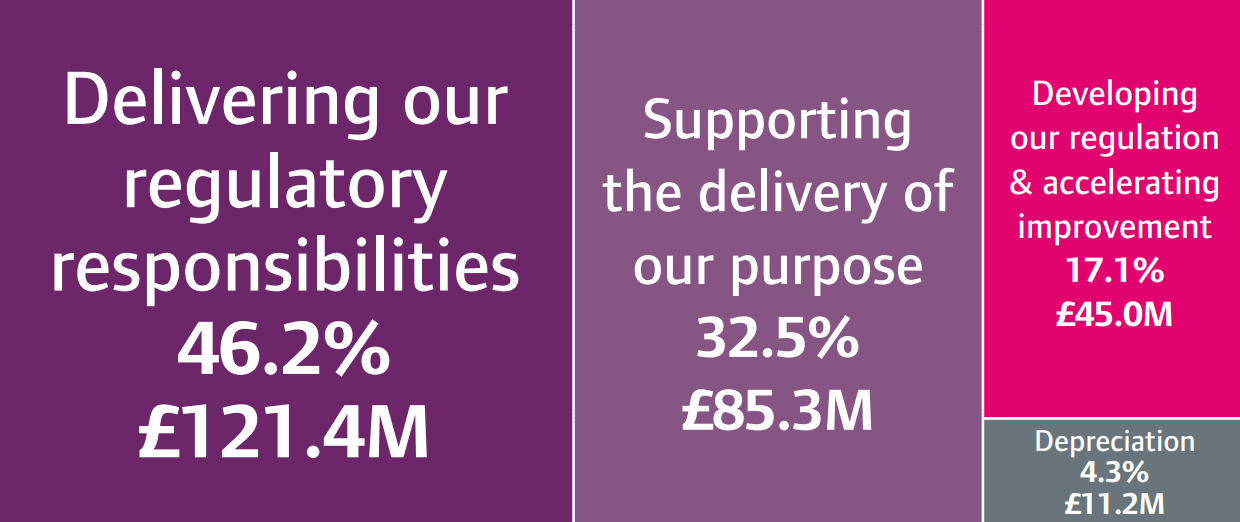
Read a text version of this diagram
- Delivering our regulatory responsibilities: 46.2% (£121.4M)
- Supporting the delivery of our purpose: 32.5% (£85.3M)
- Developing our regulation and accelerating improvement: 17.1% (£45.0M)
- Depreciation: 4.3% (£11.2M)
Delivering our regulatory responsibilities
We directed the majority (46.2% or £121.4m) of our total financial resource in 2022/23 to directly delivering our regulatory responsibilities, of which £100.3m (82.6%) was focused on our Operations Delivery. CQC has a plethora of regulatory and statutory responsibilities. Figure 9 highlights the wide range of our regulatory activity and the difference we make in health and social care. Our regulatory responsibilities grow further in 2023/24 when we provide an assessment of the performance of local authorities and integrated care systems under the Health and Care Act 2022.
Figure 9: Delivering our regulatory responsibilities

*including:
– registration
– assessment
– inspection
– enforcement
– medicines optimisation across all provider types in the following sectors:
– Adult Social Care
– Primary Medical Services
– Acute
– Mental Health
– Dental
– Independant healthcare
Breakdown of regulatory responsibilities combined under 'other' in figure 9

Supporting the delivery of our purpose
We spent £85.3m, or 32.4% of our total resource supporting the delivery of our purpose and discharging our regulatory responsibilities in 2022/23. This reflects the changing nature of our regulatory approach, with the greater part of our support costs incurred in Technology, Data and Insight as we become a smarter regulator.
Developing our regulation and accelerating improvement
Throughout 2022/23, we invested £45.0m or 17.1% of our total financial resource to continue driving forward our transformation programme, to enable us to realise our new strategy and deliver effective regulation for the years ahead. This includes £19.7m (43.5%) capital investment in assets, tools and technological platforms, and the remainder on delivering transformational change and new regulatory responsibilities.
Our expenditure profile
During 2022/23, against the total resource available to us, our total revenue expenditure (excluding non-cash items – see note 2.2 to the financial statements) was £232.5m, with a further £19.4m invested through capital expenditure.
Figure 10 shows how our revenue expenditure relates to each area of our regulatory operating model. As we regulate in a proportionate and appropriate way, there is a strong focus on higher risk providers. We are transitioning to a new approach to regulation and continue to appreciate that there are still COVID-19 challenges for providers, which need us to take a flexible approach to accommodate. This, and the year-on-year change in expenditure aligned to both monitoring and inspection, is evident in figure 10.
Figure 10: Expenditure by operating model segment

Efficiency of our operation
In 2022/23, we have again delivered our work within our operating revenue budget. Our business as usual (BAU) expenditure (excluding transformational change) profile is less than it was 5 years ago despite rising costs and inflation during this period, as we aim to conserve costs and operate efficiently as well as effectively, to deliver value for money for the public purse and become more self-reliant financially.
The sections in this report on our Performance summary and Performance analysis show our delivery across the year for our financial outlay. Highlights include:
- more informed, targeted and smarter regulatory activity during the year
- undertaking a range of activities to develop and test our approach and methodology for our new responsibilities from April 2023
- continuing to develop our new regulatory approach to provide further benefits for the public and those we regulate
- carrying out research and surveys to gather evidence and better understand the quality of care across different areas of health and social care
- using our independent voice to publish a number of reports, employing their findings to focus our regulatory activity, as well as publishing safety bulletins.
Although our total cost base is comparable to that in 2018/19, Figure 11 shows the reduction in our pay and non-pay cost-base both before and after the COVID-19 pandemic, enabling a smarter use of our overall financial resource. We have become more efficient in our operation over the last 5 years despite a challenging economic environment and inflationary pressures. Pay costs have reduced by 3.4% or £5.9m as headcount is 5.3% lower than in 2018/19; and non-pay costs have decreased by 31.4% or £17.9m through reduced travel and subsistence expenditure and a 55% reduction to our estate.
Figure 11: Total revenue expenditure since 2018/19

These reductions to our base expenditure over this period have allowed us to drive forward our transformation programme to deliver our strategic ambitions, increasing our investment to make future savings. The benefits delivered by this transformation will include smarter regulation, reducing the burden on providers and driving a more economical and effective use of our operating budget – this provides greater value for money for the providers we regulate and for taxpayers. We will continue our investment to achieve our strategic objectives and outcomes.
We have again realised Spending Review reductions in our GIA allocation for core activities (Figure 6) while absorbing the cost of our contribution to the Covid-19 Inquiry and inflationary pressures. Figure 12 shows there has been a reduction in actual Grant in Aid expenditure on recurrent ‘Core’ non-chargeable activities since 2018/19. Our expenditure has reduced by 31% or £5.8m, benefiting the public purse and demonstrating how we are more financially self-reliant.
Figure 12: Grant-in-aid expenditure on ‘core’ non-chargeable activities since 2018/19

Finally, as well as reducing revenue cost-base, we have worked hard to become more efficient in our finance operational delivery. By the end of 2022/23, our 60+aged debt and total overdue debt amounted to £2.5m (£2.5m at the end of 2021/22), and we have on average over 2 months working capital cover. We are also paying our suppliers more quickly and more consistently. We have achieved the 90% HM Treasury 5-day payment target for volume and value in March 2023, which is also our average performance across the financial year.
Find out more about our financial performance in the Statement of comprehensive net expenditure.